
Stock traders rely on technical analysis to make informed decisions about buying and selling stocks. Technical indicators are mathematical calculations used to analyze past price and volume data to identify trends and potential trading opportunities. Volatility is an essential aspect of the stock market, and traders need to understand how to measure and analyze it.
This blog post will discuss four key volatility technical indicators that every trader should know: Bollinger Bands, Keltner Channels, Average True Range (ATR), and Donchian Channels.
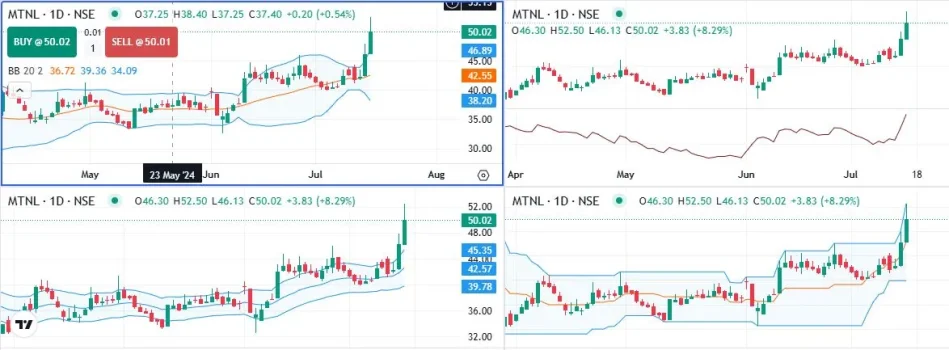
1. Bollinger Bands

Bollinger Bands are a popular volatility indicator that consists of three lines. The middle line is a simple moving average of the price. The upper and lower bands are two standard deviations above and below the middle line, respectively.
Bollinger Bands can be used to identify periods of high or low volatility. When the bands contract, it indicates a period of low volatility. Conversely, when the bands expand, it indicates a period of high volatility. Traders can use this information to identify potential trading opportunities. For example, a breakout from a Bollinger Band contraction could signal a potential trend move.
2. Keltner Channels

Keltner Channels are another volatility indicator that consists of three lines. The middle line is a simple moving average of the price. The upper and lower bands are a certain distance (average true range) above and below the middle line, respectively.
Keltner Channels can be used to identify areas of potential breakout or breakdown. When the price moves towards the upper channel, it suggests a potential breakout. Conversely, when the price moves towards the lower channel, it suggests a potential breakdown. Traders can use this information to position themselves for potential price movements.
3. Average True Range (ATR)

The Average True Range (ATR) is a volatility indicator that measures the average volatility of a stock over a specific period. It is calculated by averaging the difference between the high and low prices, the difference between the high price and the previous close, and the difference between the low price and the previous close.
The ATR can be used to set stop-loss orders. A stop-loss order is an order that automatically sells a stock if the price falls below a certain level. By using the ATR, traders can set stop-loss orders far away from the current price to avoid being stopped due to normal market volatility.
4. Donchian Channels

Donchian Channels are a simple volatility indicator that consists of two lines. The upper band is the highest price of the past n periods. The lower band is the lowest price of the past n periods.
Donchian Channels can be used to identify areas of potential breakout or breakdown. When the price breaks above the upper channel, it suggests a potential breakout. Conversely, when the price breaks below the lower channel, it suggests a potential breakdown. Traders can use this information to enter or exit trades accordingly.
Conclusion
Volatility is an essential aspect of the stock market, and traders need to understand how to measure and analyze it. The four volatility technical indicators discussed in this blog post – Bollinger Bands, Keltner Channels, Average True Range (ATR), and Donchian Channels – can be valuable tools for traders to identify potential trading opportunities and manage risk.
Disclaimer
Trading stocks involves inherent risks. Doing your own research and consulting with a financial advisor before making any investment decisions is important.
I hope this blog post has been helpful. Please leave a comment below if you have any questions.


